What Is Mean Reversion (And How to Trade It)

Mean reversion is one of the oldest ideas in trading, and one of the most useful for beginners to understand. The premise is simple: when a price stretches far away from its usual level, it tends to come back. Not always, not on schedule, but often enough that traders have built entire strategies around it. This article explains what mean reversion is, why it works, how to spot it on a chart, which indicators traders use, and how to actually place trades based on it.
What is mean reversion?
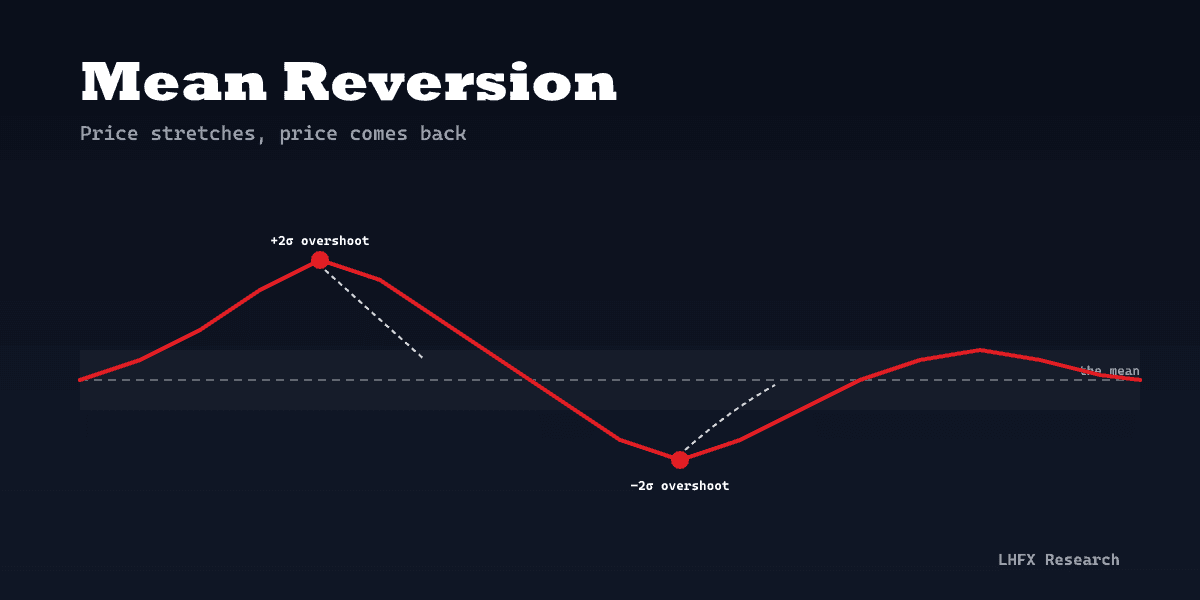
Mean reversion is the tendency for a price (or any other measurable variable) to move back toward its average over time. The "mean" is just a fancy word for the average. "Reversion" means returning. So mean reversion is the price returning to its average after wandering off.
Imagine EUR/USD spends three months trading between 1.0800 and 1.1000. The mid-point of that range is around 1.0900. If, on a Tuesday morning, EUR/USD suddenly spikes to 1.1050 on a thin liquidity move, a mean-reversion trader looks at that and thinks: "This is well above where this pair usually sits. The odds favour it drifting back toward 1.0900." That trader might short the pair, expecting reversion.
This is the entire idea. Price went too far, price comes back. The hard part is defining "too far" and proving that the price actually reverts, rather than starting a new trend.
Mean reversion vs trend following
Mean reversion is the philosophical opposite of trend following. A trend follower says: "Price is going up, so I buy. It will keep going up." A mean-reversion trader says: "Price is far above average, so I sell. It will come back down."
Both can be profitable, but they work in different market conditions. Trend following thrives when one side is dominant for weeks or months. Mean reversion thrives in choppy, sideways markets where price bounces inside a range. Knowing which regime you are in is half the battle.
Why does mean reversion work?
Three reasons, in plain language.
1. Most markets are range-bound most of the time. A common rule of thumb among quantitative traders is that markets trend roughly 30% of the time and chop sideways the other 70%. The exact split depends on the timeframe and asset, but the broad pattern holds. If price spends most of its life inside a range, then by definition it has to revert toward the middle of that range repeatedly.
2. Overreaction and the news cycle. Markets are run by humans (and algorithms written by humans). Surprise news prints, panic headlines, and forced liquidations regularly push price past where the fundamentals justify. Once the noise fades, the price tends to drift back. A central bank releases a data point, traders pile in for ten minutes, the move overshoots, and then it cools off.
3. Statistical arbitrage and big-money flows. Hedge funds and market makers run automated strategies that take the other side of overextended moves. If EUR/USD pushes 2 standard deviations above its 20-day average for no fundamental reason, there are large players ready to fade that move. Their flow itself helps the price revert. This is one reason mean reversion is more reliable on liquid pairs.
A concrete example
Here is a worked example so the concept stops feeling abstract.
Suppose EUR/USD over the past 20 trading days has had an average closing price of 1.0850, with a daily standard deviation of about 40 pips. Today the pair opens at 1.0950, which is 100 pips above the average, or roughly 2.5 standard deviations above the mean.
A mean-reversion trader looks at this and says: "Historically, when this pair has been 2 or more standard deviations above its 20-day mean, it has reverted within 5 to 10 trading days about two-thirds of the time." They short EUR/USD at 1.0950, target 1.0870 (close to the mean), and place a stop at 1.0995 (about 1 standard deviation above the entry). Risk-reward is roughly 1:1.8.
If the trade works, EUR/USD drifts back toward 1.0870 over the next week and the trader books 80 pips. If it fails, the pair keeps running and the trader loses 45 pips. Repeat this pattern enough times with a positive edge and the equity curve grinds higher.
Is the market actually mean-reverting right now?
Mean reversion only works on mean-reverting markets. The worst thing you can do is apply a reversion strategy during a strong trend, because every "overshoot" turns into the start of a bigger move. Before placing a single trade, you need to classify the regime.
The eyeball test
Open a daily chart and ask yourself a simple question: in the last 3 months, has price swung back and forth across a recognisable middle, or has it walked steadily in one direction? Pairs like EUR/USD often spend long stretches in ranges. Trends are more common during macro shocks and rate-cycle turning points.
The Hurst exponent (if you want to get technical)
The Hurst exponent is a number between 0 and 1 that classifies a time series:
- H < 0.5: the series is mean-reverting. Moves are likely to fade.
- H ≈ 0.5: random walk. No edge in either direction.
- H > 0.5: the series is trending. Moves tend to extend.
You do not need to calculate this by hand. Most quant libraries (in Python, the hurst package) will do it in two lines. Run it on the last 200 daily closes of your instrument. If H comes back at 0.42, you have evidence of reversion. If H is 0.61, do not run a reversion strategy on that instrument right now.
The simpler regime test
If you do not want to touch Python, a rough proxy works fine: take a 50-day moving average and a 200-day moving average. If they are tightly twisted around each other and price keeps crossing both, you are in a range. If the 50-day is firmly above (or below) the 200-day and price keeps respecting the 50-day, you are in a trend.
The four most common mean reversion indicators
Almost every mean reversion strategy uses one or more of these. They are different ways of answering the same question: how far is price from its average, and is that distance unusual?
1. Bollinger Bands
Bollinger Bands plot a moving average (usually 20-period) with an upper and lower band placed 2 standard deviations away. The bands automatically widen when volatility rises and contract when it falls. The classic mean-reversion read is:
- Price tags the upper band: stretched high, consider shorts.
- Price tags the lower band: stretched low, consider longs.
- Price returns to the middle band: take profit.
The catch: in a strong trend, price can ride the upper band for weeks (this is called "walking the band"). Bollinger Bands work best when paired with a regime filter, not used alone.
2. RSI (Relative Strength Index)
RSI is a momentum oscillator that runs between 0 and 100. The textbook rule says above 70 is overbought and below 30 is oversold. A mean-reversion trader watching GBP/USD might wait for RSI to drop to 28, then look for a bullish candle close to enter long, expecting a bounce back to the 50 line.
RSI is most useful on liquid, established markets. On thin or trending markets it generates a lot of false signals.
3. The z-score
The z-score is the most direct way to measure "how far from average". It is just the number of standard deviations the current price sits away from the rolling mean. Here is the four-line version in Python:
import pandas as pd
window = 20
rolling_mean = price.rolling(window).mean()
rolling_std  = price.rolling(window).std()
z_score      = (price - rolling_mean) / rolling_std
A common rule is: enter long when z < -2, enter short when z > +2, and exit when z returns to 0. The advantage of z-score over Bollinger Bands is that it gives you a single clean number you can backtest, filter, and combine with other signals.
4. Distance from a moving average
The bluntest version: just measure the percentage distance between current price and a 50-day or 200-day moving average. On Bitcoin, for example, prices more than 30% above the 200-day SMA have historically been associated with short-term cool-offs, and prices more than 25% below have often marked decent swing-long entries. The exact thresholds differ by asset, which is why you must calibrate per instrument.
How to actually trade mean reversion
Below is a basic, rule-based mean reversion trading strategy you can study, backtest, or paper-trade. It is intentionally simple; almost every refinement traders add (volatility filters, multi-asset baskets, machine-learning regime detection) is a variation on this skeleton.
The skeleton
- Pick a liquid instrument. Major FX pairs, large-cap crypto, and main indices work best. Thin pairs lie about their averages.
- Confirm regime. Check that price has spent the last 60 to 100 sessions oscillating around a recognisable level, or run a Hurst test and confirm H < 0.5.
- Calculate the z-score using a 20-period rolling window of daily closes.
- Entry rule. Go long when z drops below -2 and the current candle closes higher than the previous one (a small confirmation that the bounce is starting). Go short on the mirror: z above +2 plus a lower close.
- Stop loss. Place the stop at z = -3 for longs (or +3 for shorts). If the move keeps extending beyond 3 standard deviations, the regime is probably no longer reverting and you want out.
- Take profit. Exit when z returns to 0 (price touches the rolling mean). That is the natural target.
- Position sizing. Risk a fixed small percentage of your account on the distance between entry and stop. A common cap is 0.5% to 1% per trade.
- Time stop. If the trade has not hit either target after 10 trading days, close it. Reversion that takes too long usually never comes.
What an example trade looks like
Say EUR/USD closes at 1.1015 on a Friday. Its 20-day mean is 1.0890, its 20-day standard deviation is 60 pips, so the z-score is (1.1015 - 1.0890) / 0.0060 = +2.08. Friday''s close is also lower than Thursday''s close. Rule 4 fires: short at 1.1015.
The stop goes at 1.0890 + 3 × 60 pips = 1.1070. The target is the mean: 1.0890. Risk = 55 pips, reward = 125 pips, R-multiple = 2.27.
If the trade hits target in 6 sessions, you make 125 pips. If it stops out, you lose 55. You only need to be right about 31% of the time at this reward-to-risk ratio to break even, and a calibrated mean-reversion edge on a major FX pair typically prints closer to 55-65% win rate.
Where mean reversion fails (the trap)
Every mean-reversion trader who blows up does so in the same way: they fade a move that turns into a trend. Understanding this failure mode is more important than memorising the indicators.
Regime shifts
When a central bank surprises the market with a 50 bp hike, when a country devalues its currency, when a major exchange collapses, the previous "average" stops being the right average. Price moves to a new level and stays there. Anyone who keeps shorting at +2 standard deviations during the move gets stopped out repeatedly.
The defence is the stop loss at z = ±3 and the time stop at 10 days. They are not optional. Mean reversion without strict stops is a strategy for bankrupting yourself.
Asymmetric tails
Crypto in particular has fat upside tails. Bitcoin can sit 4 standard deviations above its 20-day mean and just keep going for another 30%. This is why pure z-score thresholds need to be wider on crypto than on FX, and why some traders avoid shorting strength in crypto altogether, restricting themselves to long-only reversion at oversold extremes.
The wrong mean
If you pick a 20-day window on an instrument that just broke a 200-day range, your "mean" is meaningless. The price spent 199 of the last 200 days on the other side of where it is now. Always check whether the rolling mean you are using actually describes the instrument''s current behaviour, not its old behaviour.
Mean reversion across asset classes
Forex
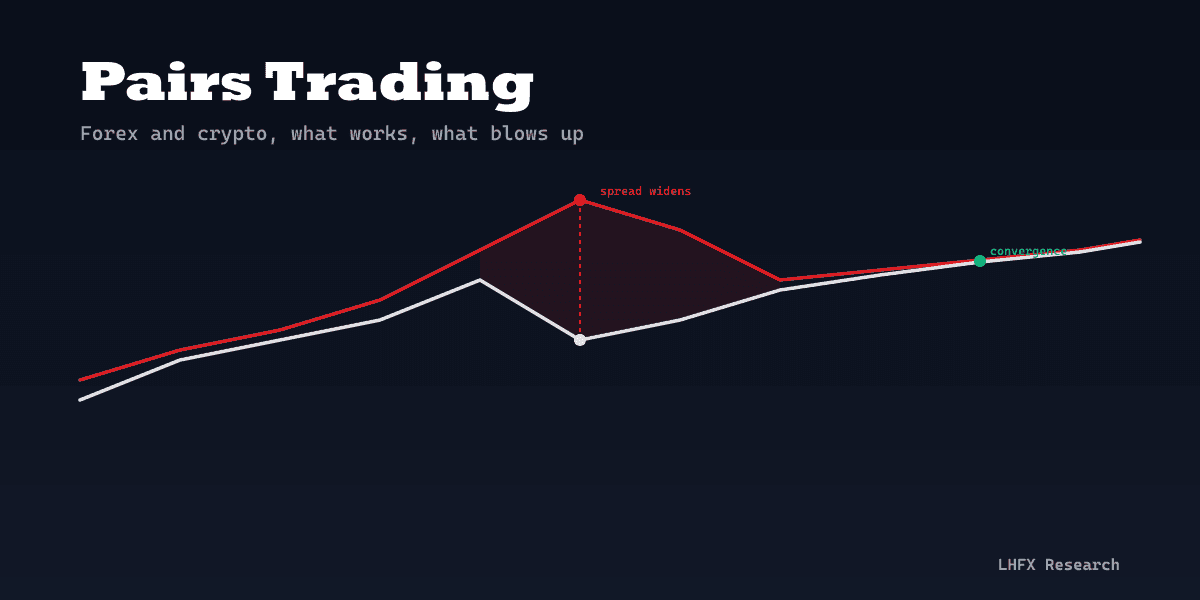
FX majors are the natural home of mean reversion. Currency pairs represent the price of one economy relative to another, and over short horizons the relative valuations are surprisingly stable. Pairs like EUR/USD, USD/JPY, and GBP/USD spend long stretches inside ranges driven by interest-rate differentials. This is also why pairs trading, which is mean reversion applied to the spread between two correlated instruments, is so popular in FX.
Crypto
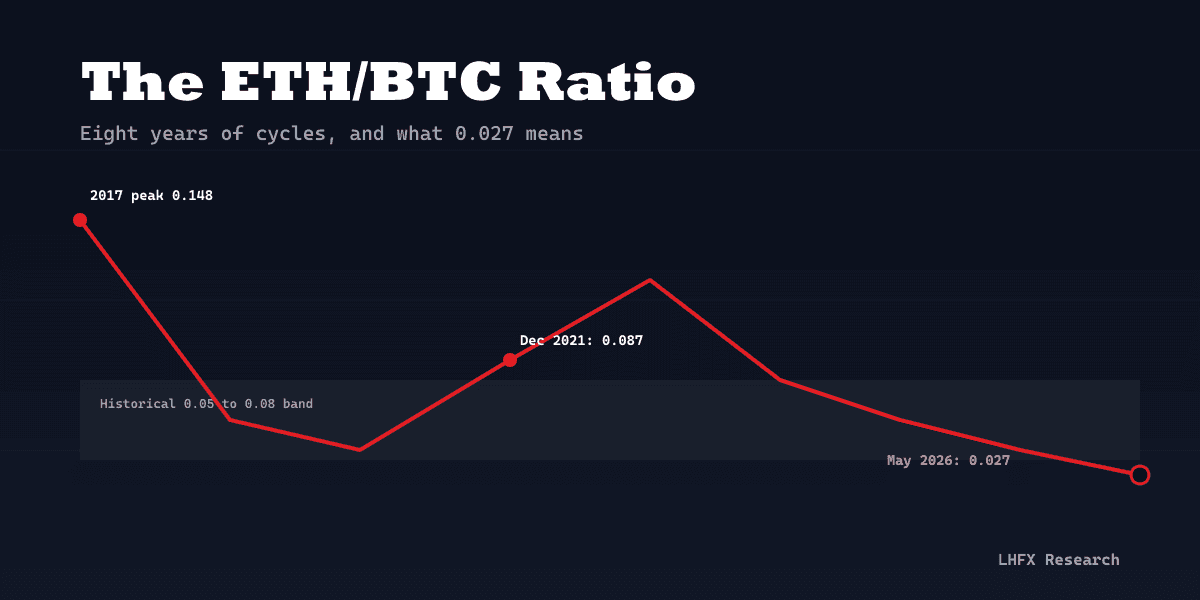
Crypto is more aggressive. Volatility is higher, trends are more violent, and tails are fatter. Mean reversion still works, but with wider bands and shorter holding periods. Many crypto reversion traders use intraday timeframes (1-hour or 4-hour) and accept that thresholds need to sit at z = ±2.5 or ±3 rather than ±2. ETH and BTC also revert relative to each other, which is the subject of our ETH/BTC ratio guide.
Indices
Stock indices like the S&P 500 revert too, but with a strong upward drift over long horizons. This means short-side reversion on indices is structurally harder than long-side reversion. The asymmetric tendency to grind higher punishes shorts who hold too long. Most index reversion traders are either long-only (buying oversold dips) or use very tight time stops on the short side.
First steps if you want to try mean reversion
- Pick one liquid instrument you already follow. EUR/USD or BTC/USD is a fine start. Do not try to run reversion on 20 markets at once.
- Confirm the regime. Look at the 6-month chart. Is there an obvious middle level? If yes, continue. If price is in a clean trend, pick a different instrument or wait.
- Paper trade for 30 days. Use a demo account. Apply the skeleton rules above. Record every trade in a spreadsheet: entry, stop, target, outcome, R-multiple.
- Calculate your hit rate and average R. After 20-30 trades you will have a real sample. If your hit rate × average win minus your miss rate × average loss is positive, your edge is real. If not, refine before risking live capital.
- Start small live. Begin with position sizes that risk no more than 0.25% of your account per trade. Scale up slowly as the live results match the paper results.
- Review monthly. Mean reversion regimes change. The pair that reverted beautifully in March can trend brutally in June. Re-test the regime every month.
The strategy is not glamorous. You will not catch the home runs that trend followers brag about. What you will get, if your edge is real and your stops are tight, is a high frequency of small, clean trades. That is the trade-off of mean reversion: more singles, fewer grand slams.
The shorthand version
- Mean reversion is the tendency for price to return to its average after stretching too far.
- It works because markets are range-bound most of the time, humans overreact, and large players fade extremes.
- The best regime indicator is "does the chart look like a range or a trend?". The Hurst exponent makes this rigorous.
- Standard indicators are Bollinger Bands, RSI, z-score, and distance from a moving average. Z-score is the cleanest to backtest.
- A simple rule-set: enter at z = ±2 with a confirming candle, stop at z = ±3, target z = 0, time stop at 10 sessions.
- The failure mode is regime shift. Use strict stops; never average down into a runaway move.
- FX majors are the natural home of reversion. Crypto needs wider bands. Indices have an upward drift that punishes shorts.
If you want a related read, our pairs trading guide extends the same logic to the spread between two correlated instruments, which is often a cleaner mean-reverting series than any single asset.
This content is for informational purposes only and does not constitute investment advice. CFDs are complex instruments and come with a high risk of losing money rapidly due to leverage.