The ETH/BTC Ratio Explained: 8 Years of History, What Drives It, and What 0.027 Means

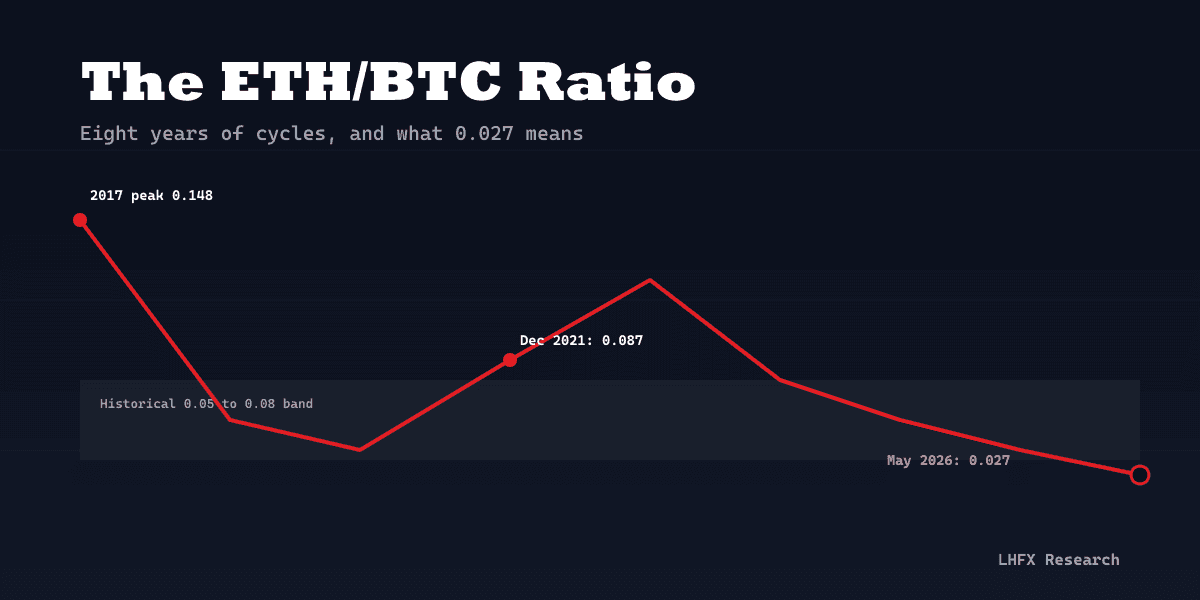
The ETH/BTC ratio is the price of one ether quoted in bitcoin. It is the single most-watched relative-value chart in crypto, and the most reliable regime gauge traders have for distinguishing a bitcoin-led market from a broad altcoin run. After eight years of cycles, the ratio sits near 0.027 in May 2026, a level last seen in early 2020.
What the ETH/BTC ratio actually measures
ETH/BTC takes one variable (the dollar price of ether) and divides it by another (the dollar price of bitcoin). The result is a unitless number: how many bitcoins one ether is worth. At 0.027, you need roughly 37 ether to buy one bitcoin. At the 2017 cycle peak of 0.148, you needed fewer than seven.
The chart removes the dollar entirely. When both assets rally together, ETH/BTC barely moves. When ether outperforms bitcoin, the ratio rises. When bitcoin outperforms ether, the ratio falls. That makes it a pure measurement of relative strength between the two largest crypto assets, and by extension, between the two largest narratives in the space: bitcoin as a monetary asset, and ether as a productive technology asset.
Why this chart matters more than any other crypto pair
- Together, bitcoin and ether account for roughly 70% of total crypto market capitalisation. Their relative performance sets the tone for everything below them.
- Historical data shows altcoins (excluding ether) tend to underperform when ETH/BTC is falling and outperform when it is rising. Traders use the ratio as a regime indicator for the broader alt market.
- ETH/BTC is one of the few crypto charts with eight full years of clean tick data, giving traders a credible mean-reversion reference range.
A short history of ETH/BTC since 2017
The ratio has cycled through five distinguishable regimes. Each one mapped to a specific narrative shift, and each one paid traders who recognised the regime change early.
2017 to early 2018: the ICO boom (peak 0.148, June 2017)
ETH/BTC hit its all-time high of roughly 0.148 in June 2017 as ICO issuance pushed billions of dollars of demand into ether, which was the settlement asset for nearly every token sale. By January 2018 the ratio was still around 0.117. Bitcoin dominance had collapsed from 86% to 33% over those twelve months.
2018 to 2020: the post-ICO winter (trough 0.017, September 2019)
Once the ICO market broke, ether had no native demand source large enough to defend its bitcoin-denominated price. The ratio bled from 0.117 to a low of about 0.017 in September 2019, an 86% drawdown against bitcoin even though ether kept some dollar value. Bitcoin dominance climbed back above 60%.
2020 to 2021: DeFi summer and the second peak (0.087, December 2021)
The launch of Uniswap, Aave, Compound and the broader DeFi stack gave ether a second demand engine: every dollar of total value locked sat in smart contracts that required ether for gas. ETH/BTC tripled from 0.025 in early 2020 to 0.087 by late 2021. It did not retest the 2017 high.
2022 to 2024: the consolidation band (0.05 to 0.08)
Through the bear market, the Merge to proof-of-stake (September 2022), the Shapella upgrade (April 2023) and the launch of multiple L2 rollups, ETH/BTC oscillated inside a 0.05 to 0.08 band for almost two and a half years. The Merge cut ether issuance by 88% but did not move the ratio durably. Most traders treated the band as the new fair value range.
2024 to 2026: the bitcoin ETF era and the breakdown
The US spot bitcoin ETFs launched in January 2024 and pulled in over $50 billion of net inflows within their first 18 months. The US spot ether ETFs launched in July 2024 but, by mid-2026, have attracted roughly an order of magnitude less. The asymmetric institutional bid for bitcoin broke the ratio below 0.05 in mid-2024, then below 0.04 in early 2025, and the May 2026 print near 0.027 is the lowest reading since April 2020.
What drives the ratio
Five forces dominate ETH/BTC across multi-month horizons. They overlap, sometimes pull in opposite directions, and weighted differently in different regimes.
Monetary regime and the digital-gold thesis
When macro investors view crypto through a store-of-value lens (rising real yields, currency debasement fears, geopolitical risk), capital concentrates in bitcoin. Bitcoin is the only crypto asset with a hard supply cap of 21 million, no protocol-level changes for over a decade, and now a regulated ETF wrapper accessible to pension funds and registered investment advisers in major markets. When that lens dominates, ETH/BTC falls.
Technology narrative cycles
When the market focuses on what crypto does (DeFi yields, NFTs, restaking, real-world assets, on-chain AI), capital rotates toward platforms that can host applications. Ether is the largest and most liquid of those platforms. DeFi summer 2020, the NFT cycle of 2021, and the restaking narrative of 2024 all coincided with ETH/BTC rallies. The current absence of a clear breakout application narrative is part of why the ratio is compressing.
Institutional flow asymmetry
Bitcoin received its US spot ETF 18 months before ether. The institutional product wrapper for bitcoin is now a $200 billion+ category. For ether, the comparable figure is closer to $15 billion. Until those flows normalise (or until ether ETFs are permitted to pass through staking yield, which they currently are not in the US), the structural bid for bitcoin will keep pressure on the ratio.
Staking yield and the supply equation
Ether currently offers a base staking yield of roughly 3.0% to 3.5% to validators. EIP-1559, live since August 2021, burns a portion of every transaction fee. In periods of high on-chain activity, ether becomes net deflationary. In quiet periods, it issues at a low single-digit rate. Bitcoin''s issuance is fixed by halving schedule, currently at roughly 0.83% per year following the April 2024 halving. When ether activity is high and burn rates exceed issuance, the supply math favours ETH/BTC strength. The May 2026 environment is closer to net neutral.
Regulatory divergence
Bitcoin''s classification as a commodity is settled in most major jurisdictions. Ether''s status has been litigated for years and remains less clean. The Commodity Futures Trading Commission has treated ether futures as commodities since 2021, but securities-law questions around staking, restaking and proof-of-stake validation have not gone away. Bitcoin trades with regulatory clarity that ether does not yet have.
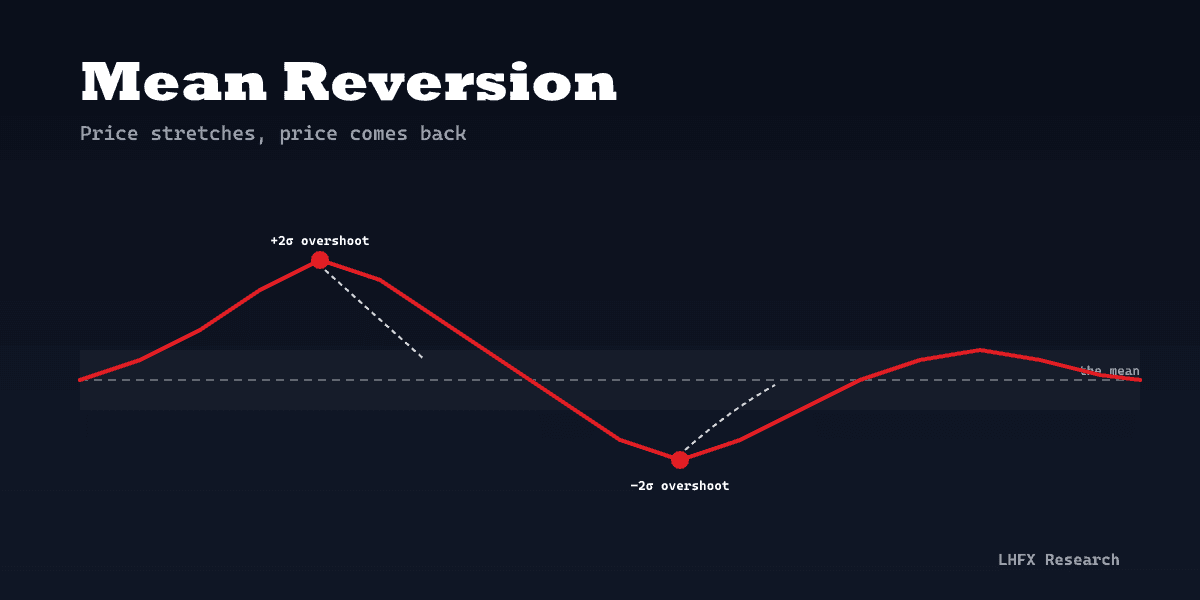
The mean reversion thesis
The most common framing among discretionary crypto traders is that ETH/BTC is mean-reverting around a long-run "fair value band". The 0.05 to 0.08 zone that held from 2020 to mid-2024 is the most-cited reference range. The argument has three pillars.
- Both assets are claims on the same end-market. Crypto adoption, on-chain usage and speculative flows touch both. Over long horizons, their growth rates should not diverge indefinitely.
- Historical extremes have always reverted. Every print below 0.025 in the 2018 to 2020 window was followed by a rally back into the 0.05 to 0.08 band within 24 months.
- Capital rotates. When bitcoin runs hard and dominance pushes above 60%, the relative-value trade into ether becomes attractive to capital that was late to the bitcoin move.
How traders use the ratio in practice
As a regime gauge
A rising ETH/BTC has historically preceded broader "altseason" behaviour. A falling ETH/BTC has been a reliable signal that capital is concentrating in bitcoin and that small-cap altcoins are likely to underperform. Many discretionary traders treat the ratio''s 50-day and 200-day moving averages as the simplest regime filter: above both, alt exposure can be sized up; below both, exposure stays in bitcoin or stablecoins.
As a pairs trade
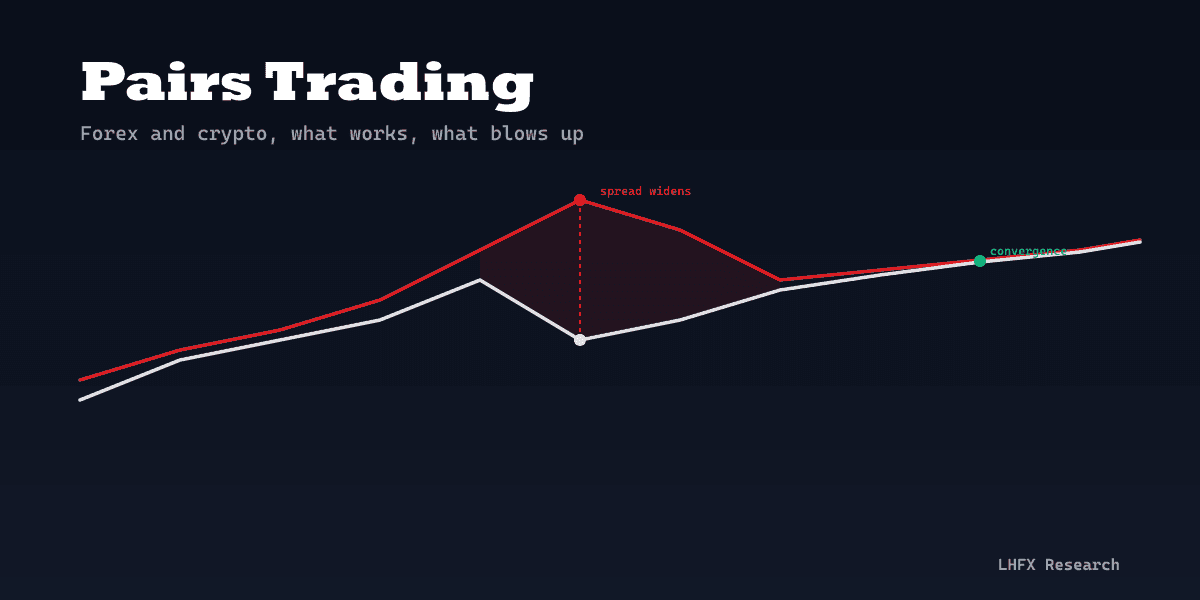
The relative-value trade is straightforward in mechanics. A trader who believes ether will outperform bitcoin over the next several months can express that view by going long ether and short bitcoin in equivalent dollar size. The position is dollar-neutral on day one and profits when ETH/BTC rises, regardless of whether crypto as a whole goes up or down. On a CFD account, the position can be opened on the same platform without transferring assets between venues. See our deeper write-up on pairs trading in forex and crypto for the full mechanics.
As an allocation rebalancing tool
Long-only crypto investors use the ratio to decide when to shift between BTC and ETH inside the same portfolio. A common rule: rebalance toward bitcoin when ETH/BTC is above the upper band, rebalance toward ether when it is below the lower band, hold the existing split when inside the band. Mechanical rules of this type avoid the emotional cost of trying to call the top and the bottom.
The mechanics on a CFD account
On a CFD account, expressing a view on ETH/BTC does not require holding either asset on a centralised exchange or in self-custody. The trade is constructed by combining two USD-denominated positions in offsetting direction.
Example: a long-ETH / short-BTC pair trade, dollar-neutral.
- Suppose ETHUSD trades at $2,400 and BTCUSD trades at $88,000.
- The ratio is $2,400 / $88,000 = 0.0273.
- To express a view that the ratio will rise, the trader goes long ETHUSD and short BTCUSD in equal dollar notional. For a $10,000 gross-each leg, that is roughly 4.17 ETH long and 0.114 BTC short.
- If ETH rallies 20% while BTC rallies 5%, the long leg gains $2,000, the short leg loses $500, and the position nets +$1,500 on $10,000 of capital deployed per side.
- If ETH falls 20% and BTC falls 30%, the long leg loses $2,000 and the short leg gains $3,000. The position nets +$1,000 despite a broad crypto sell-off.
The trade pays off when ETH/BTC rises, regardless of the direction of the overall market. It loses when ETH underperforms BTC. Position size on each leg should be scaled so the maximum acceptable loss on the combined position fits within standard per-trade risk limits. Crypto CFDs at LHFX can be traded on MetaTrader 5 against either the BTCUSD or ETHUSD markets, with overnight financing applied to each leg independently.
Sizing with a hedge ratio
Dollar-neutral is the simplest sizing rule but not the most accurate. Bitcoin and ether have different beta characteristics: ether typically moves about 1.2 to 1.5 times bitcoin in dollar terms during risk-on phases, and roughly the same multiple to the downside. A pure dollar-neutral pair can therefore be net long the crypto market even when the trader''s intent is to isolate the relative move.
A beta-adjusted pair scales the short leg larger than the long leg by the historical ratio of returns. If ether''s beta to bitcoin over the lookback window is 1.3, the short BTC leg is sized at 1.3 times the dollar notional of the long ETH leg. The result is closer to a true relative-value position. The trade-off is that the hedge ratio shifts over time and needs periodic refresh.
The risks that make this trade hard
The ratio does not have to mean-revert
The 2018 to 2020 trough lasted 18 months below 0.025 before any meaningful bounce. The current breakdown could last as long, or longer. Structural shifts (the institutional wrapper gap, regulatory divergence, the absence of a fresh narrative for ether) can keep the ratio depressed for years.
Funding rates and overnight financing
Holding a leveraged short position on bitcoin and a leveraged long position on ether incurs financing on both legs. In a sustained sideways regime, those costs accumulate and can be the difference between a profitable thesis and a losing trade. Position holders should model financing at current rates against their target hold period before opening the trade.
Correlation breakdowns
The 60-day rolling correlation between BTCUSD and ETHUSD has spent most of the post-2020 era above 0.85. It has occasionally fallen below 0.6 (for example during the Merge week, during major ETH-specific catalysts, and around US ETF approval news). Lower correlation means a dollar-neutral or beta-adjusted pair behaves less like a relative-value trade and more like two independent positions. Risk should be sized to the worst-case correlation, not the average.
Liquidity and slippage on the short leg
Short-side liquidity in crypto CFDs is generally good for BTCUSD and ETHUSD specifically, but it can deteriorate during high-volatility events. Stop-loss orders on either leg can fill at materially worse prices than the trigger during a sharp move. Limit orders and tighter position sizing partially mitigate that risk.
The 0.027 print: what the current level might mean
At 0.027, ETH/BTC is roughly 70% below its 2021 cycle high, 45% below the lower bound of the 0.05 to 0.08 band, and within striking distance of the 2019 to early 2020 lows around 0.018 to 0.022. Three interpretations sit on the table.
- The classic mean-reversion read. This is the deepest discount to the historical band in five years. If the ratio behaves like prior cycles, a move back to even the lower bound at 0.05 implies roughly 85% upside in relative terms. Bulls argue this is a generational entry for the long-ETH / short-BTC trade.
- The structural break read. Bitcoin''s institutional wrapper, regulatory clarity and store-of-value narrative have permanently pulled bid away from ether. The 0.05 to 0.08 band was a feature of the pre-ETF era and may not return. Under this read, 0.02 to 0.04 is the new range.
- The narrative-shift read. The ratio is waiting for the next demand engine on ether (a successful restaking economy, a credible AI-on-chain narrative, US ETF staking pass-through, a new application category). When and if that arrives, the ratio re-rates. Until then, it grinds.
None of these is a recommendation. They are the three frames the crypto-trading desk discusses around this chart. The decision-relevant question is not which read is correct, but which read the trader''s positioning is implicitly betting on.
TL;DR
- The ETH/BTC ratio is the price of ether quoted in bitcoin. It is the cleanest measurement of relative strength between the two largest crypto assets.
- The ratio has cycled between roughly 0.017 and 0.148 over eight years, with most of the post-2020 era spent in a 0.05 to 0.08 band.
- The May 2026 print near 0.027 is the lowest since April 2020 and sits well below the historical fair value band.
- Five forces drive the ratio: macro regime, technology narrative cycles, institutional flow asymmetry, supply dynamics (staking and EIP-1559 versus the bitcoin halving), and regulatory divergence.
- The mean-reversion thesis has worked across multiple cycles but is not guaranteed. Structural breaks can last years.
- On a CFD account, the ratio view is expressed as a long-ETH / short-BTC pair (or the reverse) sized dollar-neutral or beta-adjusted.
- The 0.027 level is consistent with three plausible interpretations: deep mean-reversion opportunity, structural regime change, or waiting for a new ether-side narrative.
Crypto CFD markets at LHFX include BTCUSD, ETHUSD, SOLUSD and a wider set of major and mid-cap crypto pairs, all tradeable on MetaTrader 5 with STP/ECN execution.
This content is for informational purposes only and does not constitute investment advice. CFDs are complex instruments and come with a high risk of losing money rapidly due to leverage.